Classifying Breast Cancer Tumors with Machine Learning
Introduction
During the course of my bioethics master’s program, one of the biggest points of discussion was the ethical spending of healthcare funds. What is the best way to divide up the money? Which population, if any, should be prioritized?
One thing that most people agreed on was that given limited resources, the money should be spent in the most effective and efficient way as possible. This meant that the investment should go to the medical procedures and technologies that provided the most return on investment - not only in terms of money but also in terms of patient lives.
So it was frustrating to learn that false-positive mammograms and over diagnosis of breast cancer cost $4 billion in healthcare spending annually. For those that are unaware, a mammogram is an x-ray picture of the breast and it is actually suggested that women get annual screenings beginning at the age of 40.
I want to focus on the term false-positive here - this means that the mammogram is determined to be abnormal even though there’s no cancer. This is happening between 22-31% of all diagnoses - a staggering rate. So I wanted to see if a classification model could be used as a more effective and efficient way of determining benign or malignant breast cancer.
Contents
- Introduction
- Data
- Creating a Classification Model
- Results
- Key Takeaways
- Future Considerations
- Link to Presentation
Goals:
- Select a classification model that can predict if a tumor will be benign or malignant:
k-nearest neighbors, logistic regression, decision tree, random forest, gaussian naive bayes, support vector machine
- Understand the importance of the F1 score for the selected model
- Recognize how machine learning algorithms can significantly improve diagnoses
Questions to Answer:
- Can a benign/malignant tumor be accurately predicted using machine learning?
- Which tumor characteristics have the greatest effect on malignant odds?
Data
I utilized the work of Dr. William Wolberg, whose breast cancer study and dataset were available in the UCI Machine Learning repository. This dataset was used to obtain the scores (1-10) for each tumor characteristic.
The tumor characteristics were defined as follows:
- Clump thickness: assesses if cells are mono- or multi-layered
- Uniformity of cell size: evaluates the consistency in size of cells in sample
- Marginal adhesion: quantifies how much cells on the outside of the epithelial tend to stick together
- Single epithelial cell size: relates to cell uniformity, determines if epithelial cells are significantly enlarged
- Bare nuclei: calculates the proportion of the number of cells not surrounded by cytoplasm to those that are
- Bland chromatin: rates the uniform “texture” of the nucleus in a range from fine to coarse
- Normal nucleoli: determines whether the nucleoli are small and barely visible or larger, more visible, and more plentiful
- Mitoses: describes the level of mitotic (cell reproduction) activity
Creating a Classification Model
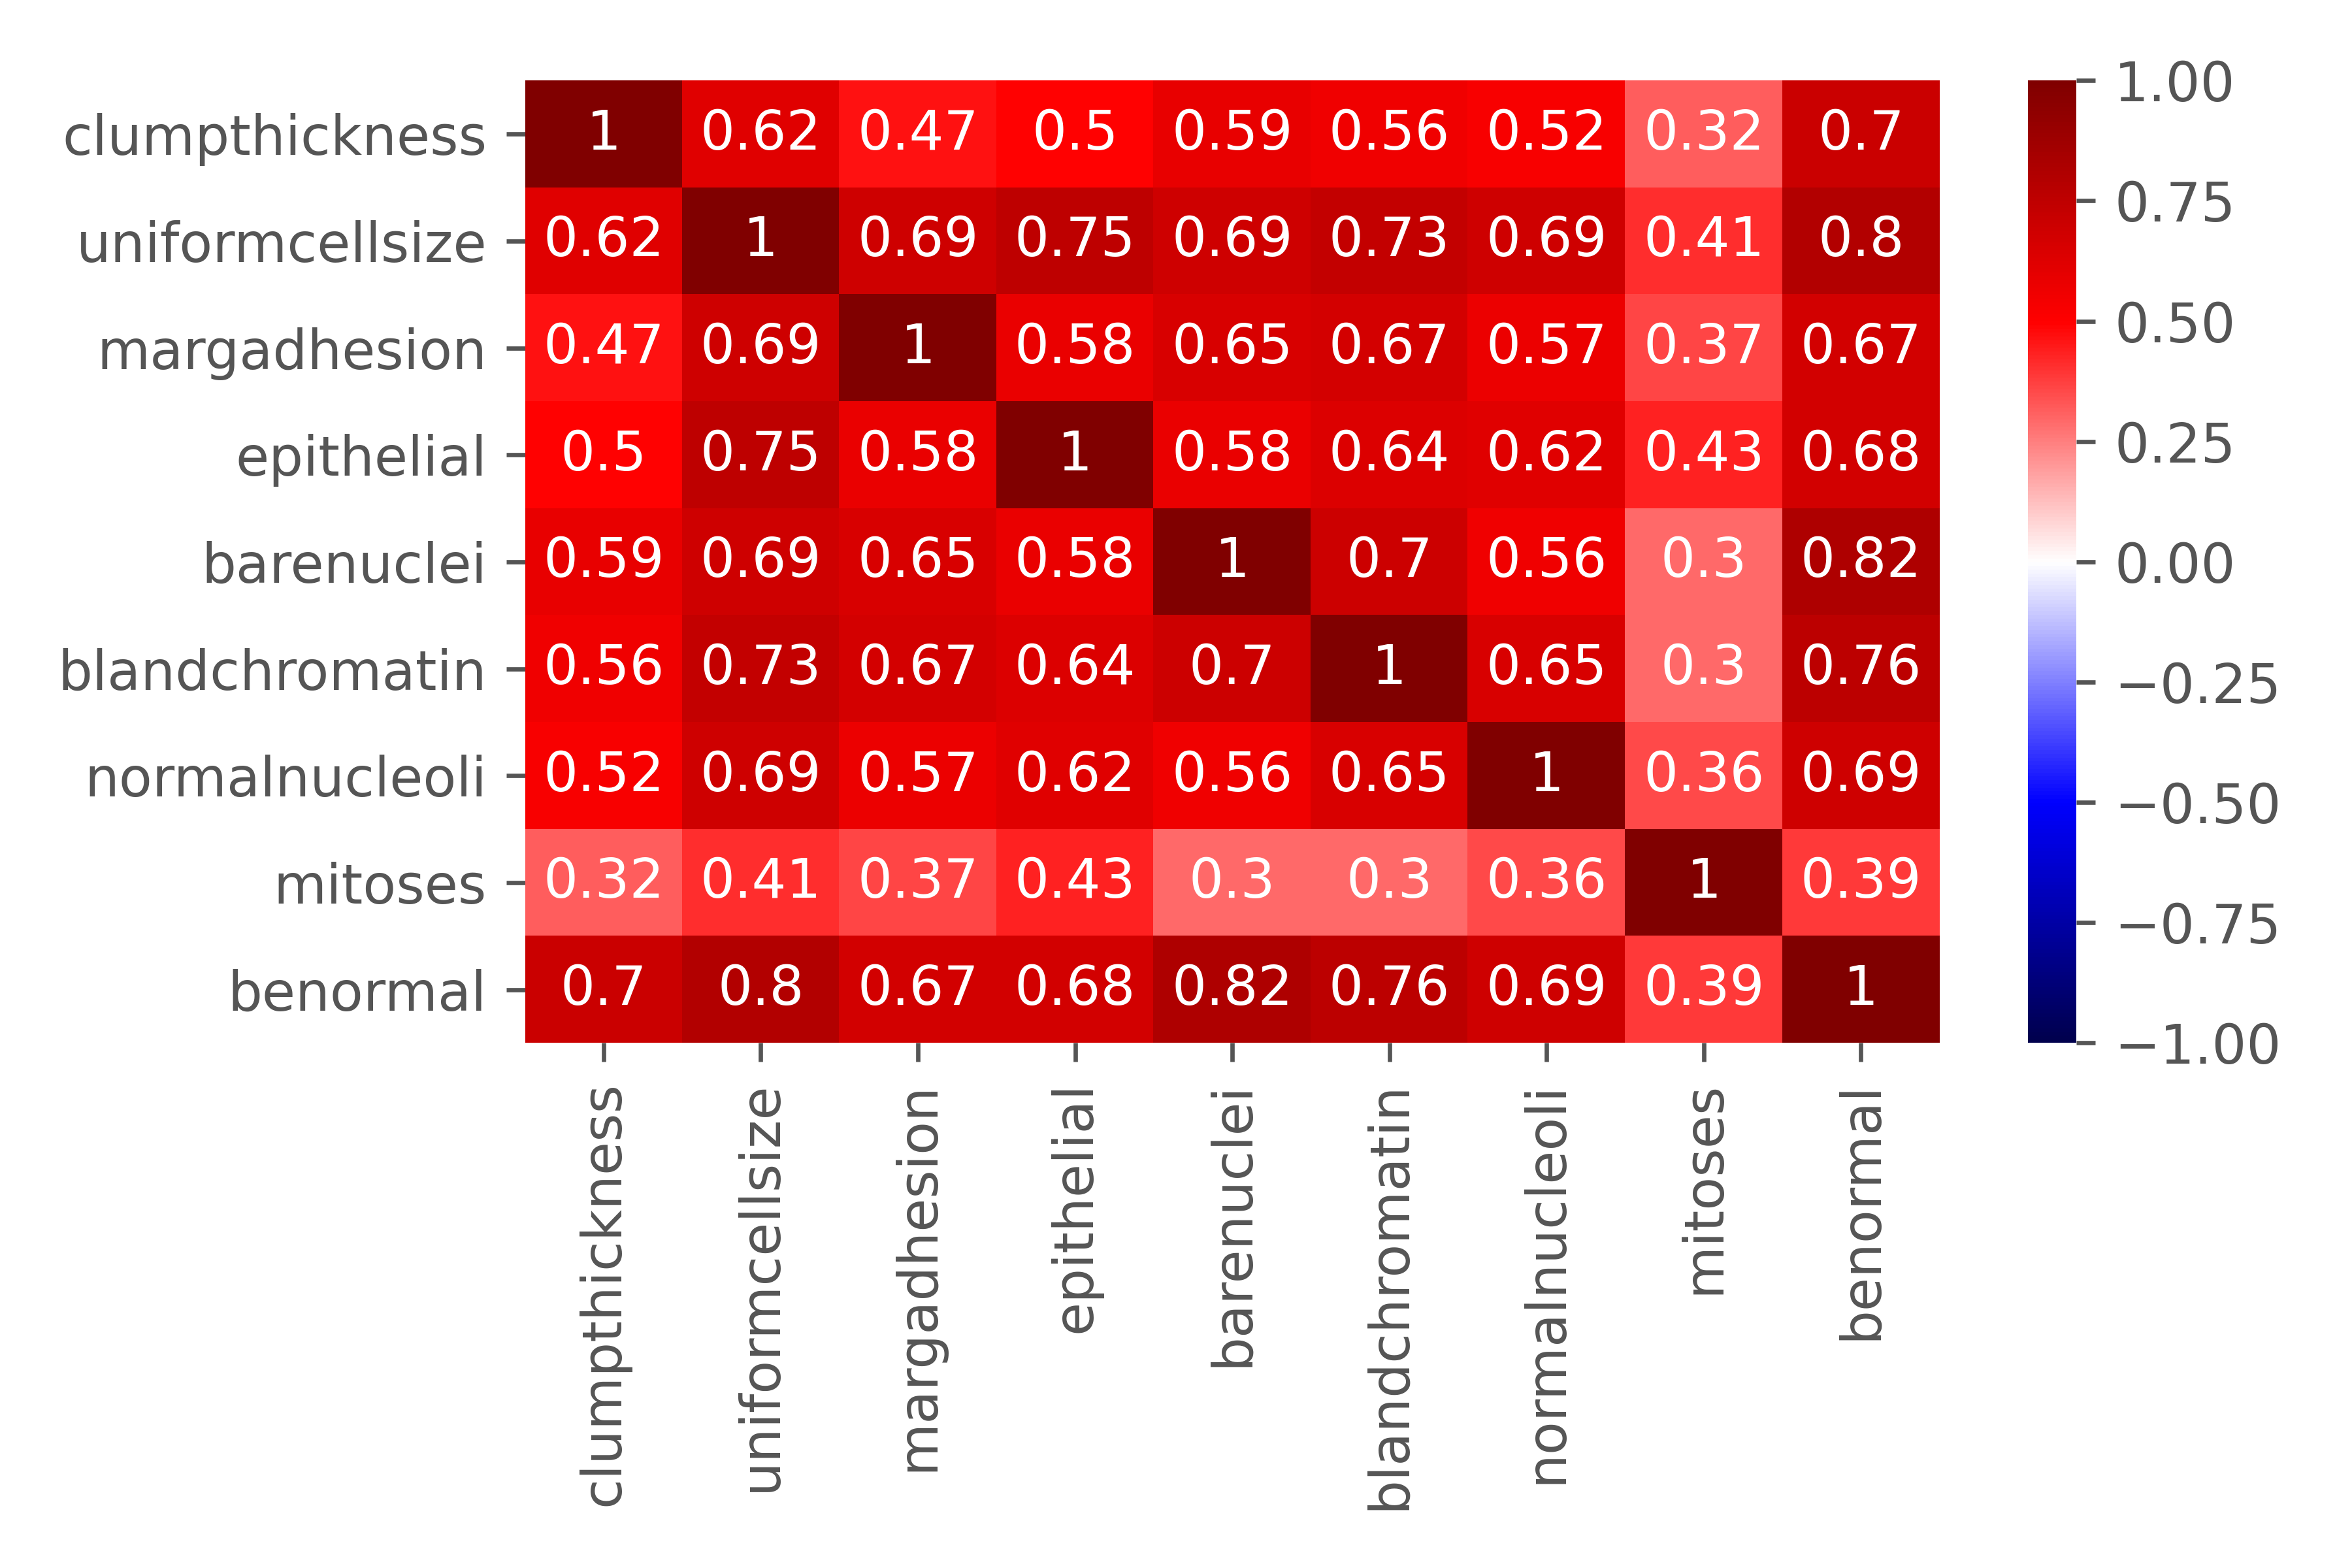
An initial baseline model was created to get a sense of how well the features (tumor characteristics) predicted a benign/malignant tumor. Then, the data was run through multiple classification models including k-nearest neighbors, logistic regression, decision tree, random forest, gaussian naive bayes, and support vector machine.
In the end, the logistic regression model was selected not only for its high scores, but also for its interpretability.
Results
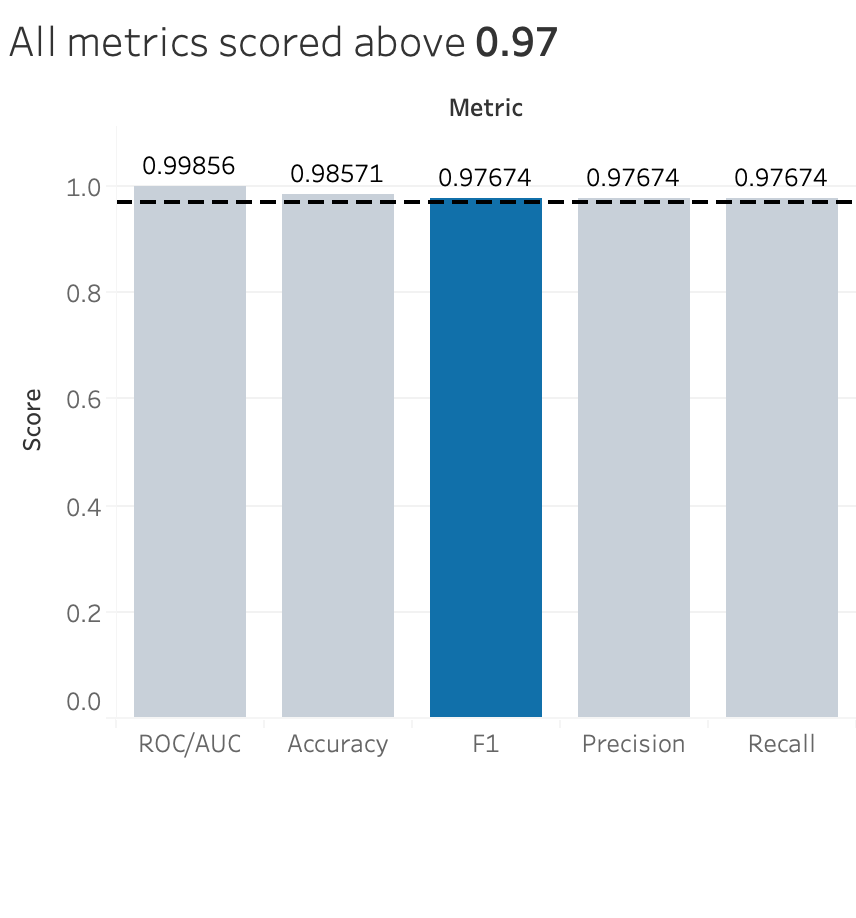
I decided to focus on the F1 score for discussion. Typically, for medical cases, the focus is on the precision score, which focuses on the true positives out of the total positive cases. This means that people want to focus more on correctly diagnosing malignant breast cancer to the patients that actually have malignant breast cancer. This I completely agree with - as many as 90,000 women are misdiagnosed per year, which causes significant physical, financial, and psychological harm to patients. However, I’d argue that false negatives are just as damaging to patients, if not more, than false positives. The patient is being told that they don’t have malignant breast cancer but in reality, they do. Thus, I selected the F1 score in order to take into account both important aspects of the diagnosis.
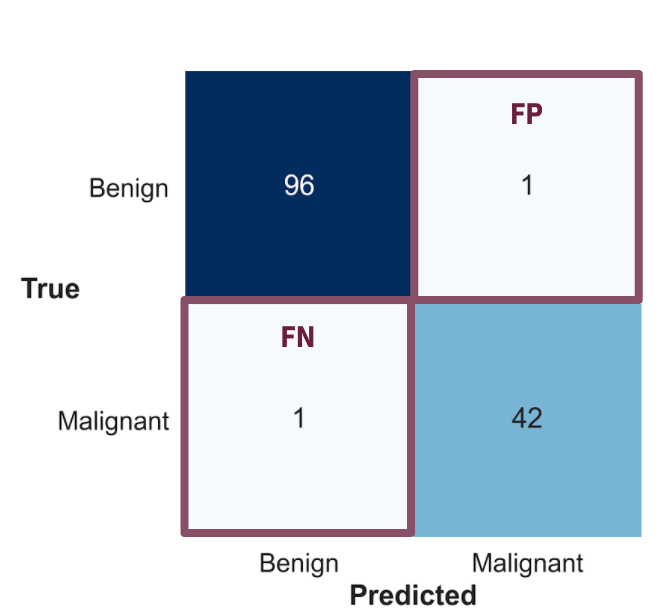
You can see above that the confusion matrix is showing that my model did really well in predicting benign or malignant breast cancer. Both the false positives and false negatives are held really low, making the model a great way to avoid misdiagnoses.
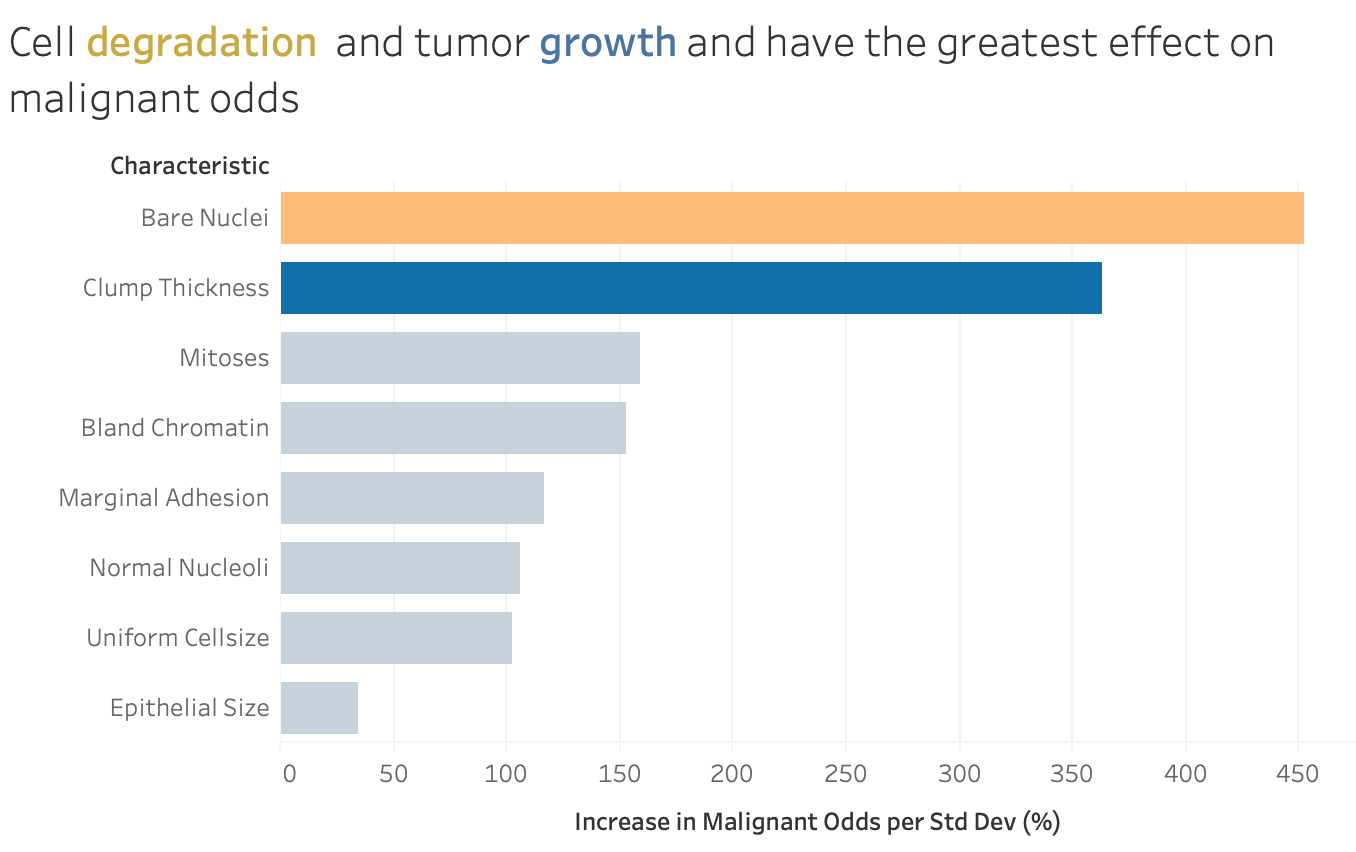
The model coefficients show the relative effect of the characteristics on the odds of a tumor being malignant. The graph shows that cell degradation (represented by bare nuclei) and tumor growth (represented by clump thickness) have the greatest effect on malignant odds. This makes sense as cancers in general are defined by their abnormal growth due to some type of mutation in the cell’s function.
Flask App Demo
This is a flask app that I created to demonstrate the effects of the characteristics on the odds of a tumor being benign or malignant. Just like the graph above, the app reinforces the idea that cell degradation and tumor growth have the greatest effect on malignant odds.
This same app has been deployed using Streamlit and is available here: https://breast-tumor-classifier.herokuapp.com
Key Takeaways
-
Using machine learning algorithms along with human interpretation can significantly improve breast cancer diagnoses. I’m not saying we should completely replace human doctors, but these classification models can provide supporting evidence. At the end of the day, we can all agree that the goal is to improve patient lives.
-
Also, with the saved costs in decreasing misdiagnoses , the money can be used in other areas of healthcare that may need it more. $4 billion is a relatively small percentage of the entire US healthcare spending, but its use can still have significant impact. It’s better served in areas such as research rather than misdiagnoses.
Future Considerations
- Creating and testing image recognition models on the mammograms themselves. This presentation compared mammograms to tumor samples, which is not exactly an apples to apples comparison.
- Understand the cost differences between getting a mammogram and a tumor sampling - including things such as coverage by insurance, result timing, etc.
- Test my classification model on more recent research and data.
